
In Nek5000 the coarse grid solver of the pressure preconditioner has been implemented in two ways. One method is called XXT solver [1] that is based on a Cholesky factorization of matrix A into XX^T, where the sparse matrix X remains the sparsity pattern of A in maximum. In the current Nek5000 OpenACC implementation, the XXT coarse grid solver runs on CPUs and therefore it requires data movements between host and devices.
In order to improve the performance of the coarse grid solver, we need to know exactly how much time spends on the solver during the solution phase. This is not so easy because the coarse grid solver is also employed in the initialization phase. In addition, the modern compilers automatically optimize the functions for XXT solver as inline functions. As a result, profiling of the XXT solver and its subroutines can be a complex task.
With the assistance of Ilya Zhukov (JSC) from the EU H2020 Centre of Excellence, Performance Optimisation and Productivity (POP) [2], now we are able to measure the time of the coarse solver with acceptable overhead. All measurements were collected with Score-P [3], and analysed in performance report explorer CUBE [4] and trace viewer Vampir [5].
A graphical representation of the application execution is depicted in the picture below (executed on one compute node of JUWELS Booster [6] with four MPI processes and four GPUs). The timeline is depicted on the top, where each line represents MPI processes or CUDA stream. MPI routines are depicted in red, idle GPU time in yellow, CUDA API and kernels are shades of blue, and user routines are shades of green. Process timeline of MPI rank 0 depicted at the bottom, where chart’s timeline split into levels, which represent the different call stack levels of function calls.
Both charts show two explicit phases of the main computation part of Nek5000, i.e. the transient computation phase at the beginning (dashed frame) and the stable one (solid frame).
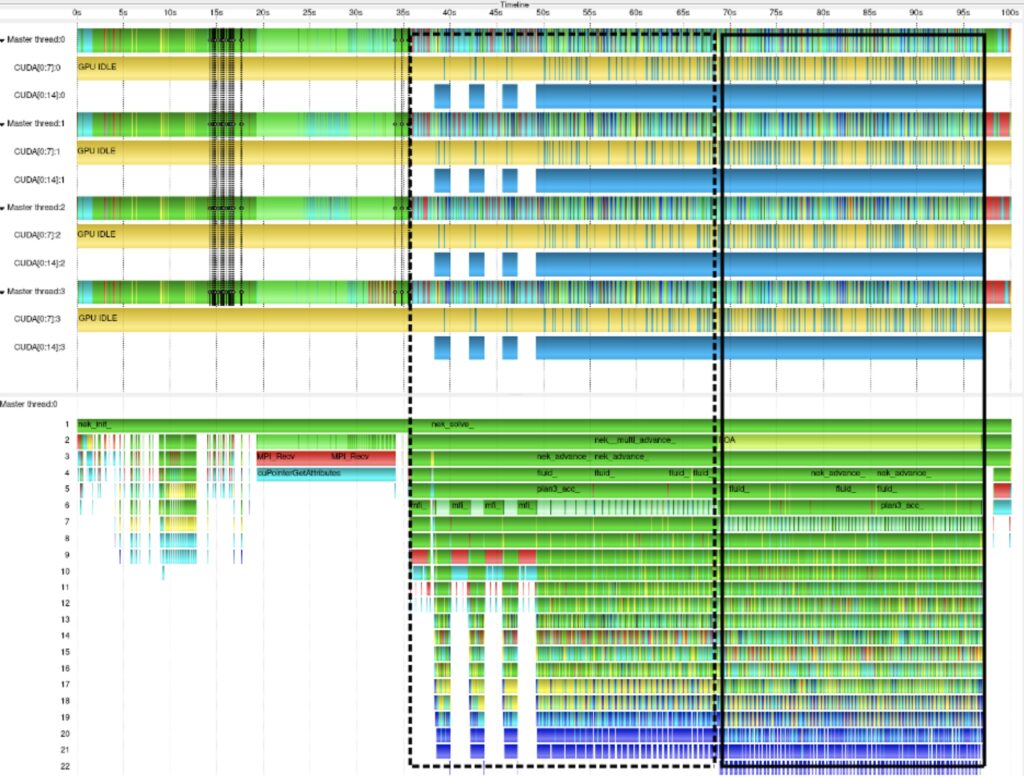
In our analysis we consider only the stable part of execution, i.e. the last 20 timesteps of the computational loop. This was easy to implement by using Score-P manual instrumentation, i.e. inserting preprocessor directives SCOREP_USER_REGION_BEGIN/ SCOREP_USER_REGION_END into the source code of driv2.f file
SCOREP_USER_REGION_DEFINE( reg )

do i = 1,50
  	if ( i==30) then
        	SCOREP_USER_REGION_BEGIN(reg, "FOA", SCOREP_USER_REGION_TYPE_COMMON)
  	end if
end do

SCOREP_USER_REGION_END( reg )
After re-compilation and execution of Nek5000 with the aforementioned annotation, Score-P provides profile/traces where our focus of analysis can be easily identified by the name FOA (see process timeline chart). Moreover, we exclude “not interesting” functions from our measurements by providing an extensive filter file to Score-P, and we disabled inlining by providing a corresponding option to the compiler.
The following Figure shows the percentage of total computation time aggregated across all MPI ranks (executed on 32 nodes of JUWELS Booster with 128 MPI ranks). As expected, the two functions apply_X2 and apply_Xt2, which are the corresponding sparse-triangular-solve, dominate the computation times (more than 70%).
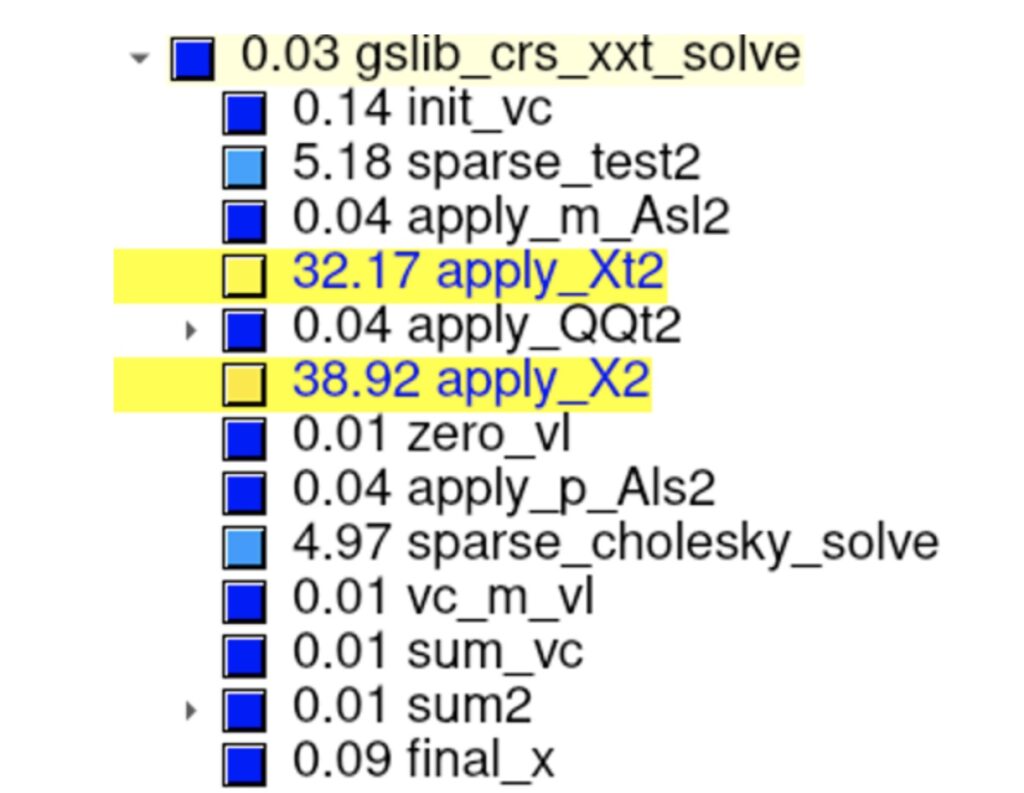
With these data we have two potential optimization options, i.e. parallelize these two functions on CPUs using OpenMP tasks or port them to GPUs. Since this solver can be difficult to parallelize in principal, we plan to use the other method for the coarse grid solver, i.e. a single V-cycle of a highly-tuned AMG solver.
[1 ] H. Tufo and P. Fischer. Fast parallel direct solvers for coarse grid problems. Journal of Parallel and Distributed Computing, 61(2):151 – 177, 2001.
[2] Performance Optimisation and Productivity (POP) https://pop-coe.eu/
[3] Score-P: Scalable Performance Measurement Infrastructure for Parallel Codes, www.score-p.org
[4] CUBE: performance report explorer, https://www.scalasca.org/scalasca/software/cube-4.x/download.html
[5] Vampir: trace viewer, https://vampir.eu/
[6] JUWELS Booster overview, https://apps.fz-juelich.de/jsc/hps/juwels/booster-overview.html